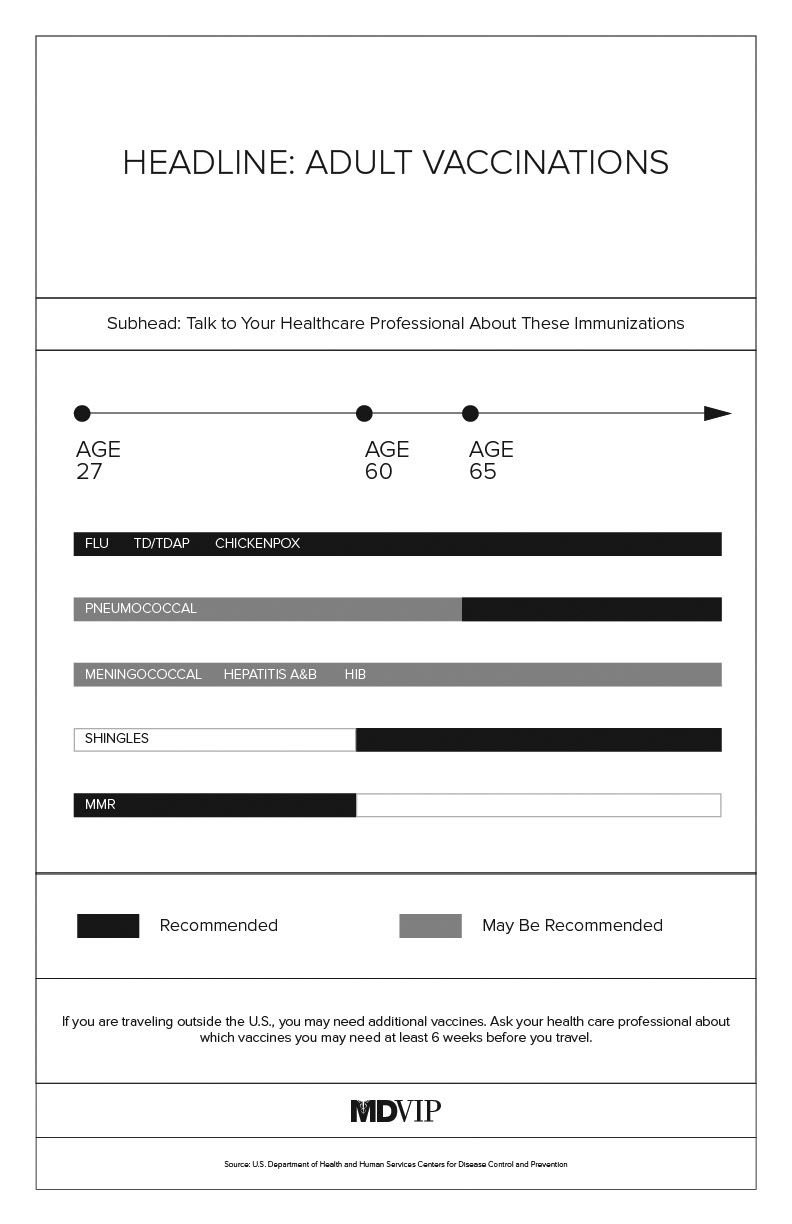
MDVIP requested a series of digital infographics to support patient education. The infographics covered various topics including vaccinations, hospitalizations, doctor-patient satisfaction, advanced testing benefits and health condition control. The vaccination infographic (below) was for use in digital educational kit. The remainder of MDVIP infographics were designed for web use. The design of the vaccination graphic follows the flat style of the brand with the introduction of a subtle background color transition and slight shadowing to follow 2018 design trends.
Several wireframes were developed to streamline the originally supplied content for the vaccination infographic. The first focused on the type of vaccine, the second by age and the third was designed in timeline format. The third wireframe supported the final graphic shown above.


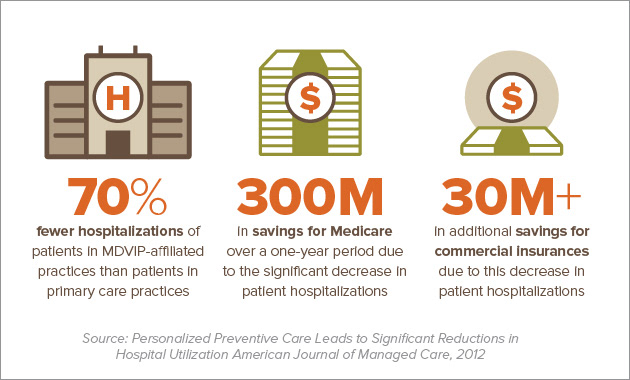
The additional infographics were designed to align to the MDVIP color palette for use on their newly launched website. The infographic shown below focused on fewer hospitalizations of patients in MDVIP-affiliated practices.
Below are additional versions of the fewer hospitalization infographic. Exploration of different styles of graphics, flat and isometric, were examined. A version with additional copy was also explored.


Once the style of the infographics was determined, designs for additional topics followed suit. Examples of some additional topics are shown below.
CREDITS:
Design, Illustration, and Copy: Mary Sarlo Carmichael
Additional Copy: MDVIP
Additional Copy: MDVIP


